El análisis del tráfico de red describe cómo una plataforma NDR recopila, procesa y examina el tráfico en una red empresarial híbrida para detectar el comportamiento de los atacantes en tiempo real. Un análisis eficaz del tráfico de red abarca cómo se captura el tráfico desde entornos locales, cloud y remotos; cómo se procesa para convertirlo en metadatos relevantes para la seguridad; cómo se examinan las sesiones cifradas sin necesidad de descifrarlas; cómo se deriva la identidad a partir de los protocolos de red; y cómo se implementan y escalan los componentes de análisis. Esta página explica cada capa para los equipos de seguridad que evalúan o implementan NDR.
Cómo funciona el análisis del tráfico de red en la arquitectura NDR
El análisis del tráfico de red en NDR se basa en tres capas interdependientes: captura de tráfico, análisis de comportamiento e integración de respuestas. Los sensores desplegados en los distintos segmentos de la red capturan el tráfico sin procesar y envían los metadatos a un componente de procesamiento —comúnmente denominado «dispositivo Brain»—, que analiza dichos metadatos utilizando modelos de IA basados en el comportamiento. Los resultados de la detección se muestran en una interfaz de gestión y se transmiten a sistemas posteriores, como SIEM y SOAR.
A diferencia de las herramientas centradas en los puntos finales, el NDR opera a nivel de red, lo que significa que detecta todos los dispositivos que se comunican en el entorno, ya sean gestionados, no gestionados, cloud o de IoT/OT, independientemente de si tienen instalado un agente de seguridad. Esto proporciona a los equipos de seguridad visibilidad sobre el movimiento lateral, el tráfico este-oeste y la actividad basada en identidades, aspectos que las herramientas de puntos finales no pueden observar.
La arquitectura está diseñada para funcionar sin agentes en el punto de captura. Los sensores reciben una copia del tráfico de red a través de puertos SPAN, TAP o duplicación cloud, y no requieren una instalación en línea ni la interceptación del tráfico. Esto minimiza la complejidad de la implementación y evita introducir latencia en los flujos de tráfico de producción.
Control del tráfico este-oeste frente al tráfico norte-sur
La supervisión del tráfico de red abarca dos direcciones principales de tráfico, cada una de las cuales revela un tipo distinto de comportamiento de los atacantes. El tráfico norte-sur se desplaza entre los sistemas internos y destinos externos; es aquí donde se hacen visibles las comunicaciones de mando y control, la exfiltración de datos y la actividad de las redes de bots. El tráfico este-oeste se desplaza lateralmente entre los sistemas internos; es aquí donde tienen lugar el reconocimiento, la escalada de privilegios y el movimiento lateral una vez que el atacante ya se ha afianzado en el sistema.
La mayoría de las herramientas de seguridad perimetral se centran en el tráfico norte-sur en el perímetro de la red. Esto deja la visibilidad este-oeste prácticamente sin cubrir. Cuando un atacante utiliza credenciales válidas para desplazarse entre servidores, cargas de trabajo o sistemas de identidad, esa actividad discurre en dirección este-oeste y no activará alertas en las herramientas que solo inspeccionan el tráfico de entrada y salida.
NDR subsana esta laguna al capturar el tráfico en segmentos de la red interna, dentro de los centros de datos, en cloud y entre las distintas sedes del campus, y no solo en el perímetro. Esto permite que los modelos de comportamiento observen los movimientos laterales a medida que se producen, antes de que un ataque alcance su objetivo. Para comprender mejor cómo los atacantes aprovechan las lagunas de cobertura más allá de los puntos finales, las rutas de ataque que surgen en esos puntos ciegos son precisamente donde el análisis a nivel de red aporta el mayor valor diferenciador.
En la tabla siguiente se relacionan los distintos sentidos del tráfico con los patrones de ataque que revelan. Los equipos de seguridad deben asegurarse de que la ubicación de los sensores cubra ambos flujos en todos los segmentos de la red en los que operan sistemas sensibles.
Tipo de tráfico
Propósito
Ejemplos
Norte/Sur
C&C, exfiltración, detección de redes de bots
Del servidor a Internet, del usuario a Internet
Este/Oeste
Reconocimiento, detección de movimientos laterales
De servidor a servidor, de usuario a servidor, de usuario a usuario
¿Qué tráfico debe capturar (y excluir) el análisis de tráfico de red?
Un análisis eficaz del tráfico de red capta los protocolos que revelan la intención del comportamiento, los eventos de autenticación, las comunicaciones entre servicios y la actividad a nivel de sesión, al tiempo que excluye el tráfico de gran volumen que genera ruido sin aportar ningún valor en materia de seguridad. La selección de protocolos influye directamente en la precisión de la detección y en el rendimiento del dispositivo.
Las tablas que figuran a continuación recogen las directrices operativas derivadas directamente de las especificaciones de implementación de Vectra NDR. Léalas en su conjunto: lo que se capture determina la cobertura de la detección; lo que se excluya determina la precisión del modelo y la eficiencia del dispositivo; y lo que mejore el HostID determina la fiabilidad con la que la plataforma atribuye la actividad a hosts e identidades específicos.
Protocolos que conviene capturar frente al tráfico que conviene excluir
En la columna de la izquierda se enumeran los protocolos que transmiten señales de comportamiento: autenticación, llamadas de servicio y datos de sesión. En la columna de la derecha se enumeran las categorías de tráfico que consumen capacidad sin mejorar la detección. La captura de los tipos de tráfico excluidos aumenta la carga del dispositivo e introduce ruido que reduce la precisión del modelo de IA.
Es importante tener en cuenta
Deberían excluirse de la captura
DCE/RPC
Protocolos de enrutamiento básicos
DHCP
Datos de copia de seguridad que requieren un gran ancho de banda
DNS
Cargas de trabajo de computación de alto rendimiento (HPC) que requieren un gran ancho de banda
HTTP
Cargas de trabajo de HPC que están bien aisladas
ICMP
Conmutación de etiquetas multiprotocolo (MPLS)
Kerberos
Protocolo de inicio de sesión (SIP)
LDAP
Sistemas de archivos de redes de almacenamiento (se puede utilizar SMB)
NTLM
Multidifusión de vídeo
Radio
RDP
PYME
SMTP
SSH
SSL/TLS
X.509
Tráfico de otras sesiones
¿Qué ayuda a mejorar el HostID de Vectra?
La precisión en la identificación de los hosts depende de que la plataforma respete los protocolos que transmiten las señales de denominación de dispositivos e identidades. Los siguientes factores, tanto basados en protocolos como en la integración, mejoran la fiabilidad con la que la plataforma atribuye la actividad de red a hosts e identidades específicos, incluso cuando cambian las direcciones IP.
Los sensores Vectra NDR son compatibles con los siguientes formatos de encapsulación de red, lo que garantiza la compatibilidad con las arquitecturas modernas cloud de centros de datos, campus y cloud .
Encapsulación compatible
GINEBRA
Encapsulación de enrutamiento genérico (GRE)
IEEE 802.1ad (conocido como QinQ)
IEEE 802.1Q (VLAN)
Encabezado de autenticación IPSec (IPSec AH)
Red de área local virtual extensible (VXLAN)
Fuentes habituales de captura de tráfico
El tráfico de red llega a Vectra Sensors a través de los siguientes mecanismos de captura. La fuente adecuada depende de la arquitectura de red, el tipo de entorno y de si la implementación abarca una infraestructura local, cloud o híbrida.
Recomendaciones de ubicación: Los sensores deben instalarse en el lado sur de cualquier dispositivo proxy o NAT para identificar con precisión el host de origen. Cuando el tráfico procedente de varios hosts se agrega detrás de un proxy a una única dirección IP, la plataforma NDR debe configurarse para reconocer dicho proxy y mantener así la precisión de la detección. Las sucursales remotas pequeñas no suelen requerir un sensor dedicado; el tráfico procedente de esos sitios suele ser visible en las ubicaciones centrales donde ya hay sensores instalados. Para obtener orientación sobre el dimensionamiento de dispositivos físicos y virtuales por nivel de rendimiento, consulte las especificaciones de los dispositivos y sensores.
Cómo funciona el análisis del tráfico cifrado en NDR
La gran mayoría de las detecciones de NDR no requieren el descifrado del tráfico. Los modelos de IA basados en el comportamiento analizan los metadatos derivados de sesiones cifradas, la sincronización de los paquetes, el tamaño de las sesiones, los patrones de conexión, los atributos de los certificados y el comportamiento de los protocolos, con el fin de identificar actividades maliciosas sin inspeccionar el contenido de la carga útil. Esto hace que el análisis del tráfico de red resulte eficaz contra las técnicas que utilizan los atacantes para ocultar los canales de comando y control en el tráfico cifrado, uno de los comportamientos de ataque que con mayor frecuencia pasa desapercibido en los entornos empresariales.
Se trata de una distinción arquitectónica fundamental. El descifrado en línea conlleva latencia, problemas de privacidad, complejidad normativa y un coste significativo de infraestructura. El NDR evita estas desventajas al operar sobre metadatos en lugar de sobre cargas útiles en texto plano, una postura respaldada por el hecho de que las arquitecturas modernas ya no requieren el descifrado en línea para lograr una cobertura significativa en la detección de comportamientos.
Hay pocos casos en los que el acceso a los metadatos del tráfico descifrado aporte un valor añadido:
Equipos que utilizan funciones avanzadas de investigación o recuperación de datos y que necesitan el contenido descifrado de las sesiones para realizar análisis forenses
Implementaciones que utilizan reglas de coincidencia de patrones en las que determinadas firmas solo se activan cuando el contenido de la carga útil es inspeccionable
Cuándo es necesario el descifrado: el enfoque de canalización paralela
Cuando se requiere analizar tanto el tráfico cifrado como el descifrado, esto debe gestionarse mediante flujos de procesamiento en paralelo, y no enviando ambos tipos de tráfico al mismo Sensor. El envío de ambos flujos a un único Sensor hace que la lógica de deduplicación descarte uno de ellos (normalmente la versión descifrada, ya que el descifrado añade una sobrecarga de procesamiento que hace que llegue más tarde). El enfoque correcto consiste en implementar un Sensor dedicado, emparejado con un dispositivo Brain independiente, para el flujo de tráfico descifrado. Los sensores virtuales y los dispositivos Brain son compatibles sin coste adicional de licencia para este fin.
Cómo funciona la detección de identidades de red a partir de los metadatos del tráfico
La detección de identidades en la red obtiene el contexto de identidad directamente de los protocolos de red, en lugar de basarse únicamente en la telemetría comunicada por los agentes o en la ingesta de registros. Mediante el análisis del tráfico de autenticación que circula por la red, los tickets de Kerberos, las consultas LDAP, los intercambios NTLM y las llamadas DCE/RPC, la plataforma construye una imagen continua de qué identidades están activas, a qué recursos acceden y cómo se compara su comportamiento con las líneas de base establecidas. Esto hace que el enfoque sea especialmente eficaz para detectar ataques de identidad basados en privilegios, en los que las cuentas comprometidas operan dentro de los límites de acceso esperados, pero se comportan de forma anómala en los patrones de autenticación.
Además, las cuentas de servicio que se autentican entre sistemas, las cargas de trabajo que realizan llamadas a la API y los agentes de IA que se desplazan por la infraestructura generan tráfico de red en el que se puede identificar a los usuarios, incluso cuando no hay ningún agente de punto final presente en dichos sistemas.
La siguiente tabla relaciona cada protocolo relevante para la identidad con el comportamiento del atacante que este pone de manifiesto y explica por qué es importante desde el punto de vista operativo.
Protocolo
Lo que revela
Se ha detectado el comportamiento de un atacante
Kerberos
Autenticación basada en tickets en entornos Windows
«Pass-the-ticket», Kerberoasting, abuso del «golden ticket»
LDAP
Consultas al servicio de directorio y actividad de enumeración
Enumeración de cuentas, detección de privilegios, reconocimiento de Active Directory
NTLM
Flujos de autenticación de desafío-respuesta
Pass-the-hash, retransmisión NTLM, captura de credenciales
DCE/RPC
Llamadas a procedimientos remotos entre servicios de Windows
Movimiento lateral mediante la ejecución de servicios remotos
DHCP
Denominación de dispositivos y asignación de direcciones de red
Identificación de hosts, detección de dispositivos no autorizados
DNS
Resolución de nombres y asignación de identidades de dispositivos
Túneles DNS, C2 a través de DNS, identificación de hosts
La detección de identidades de red también contribuye a la precisión en la identificación de los hosts. El DNS, el DNS inverso, el DNS multicast, Kerberos, el DHCP y NetBIOS son las principales señales que se utilizan para asociar la actividad de red con hosts e identidades específicos, lo que permite una atribución coherente incluso cuando cambian las direcciones IP.
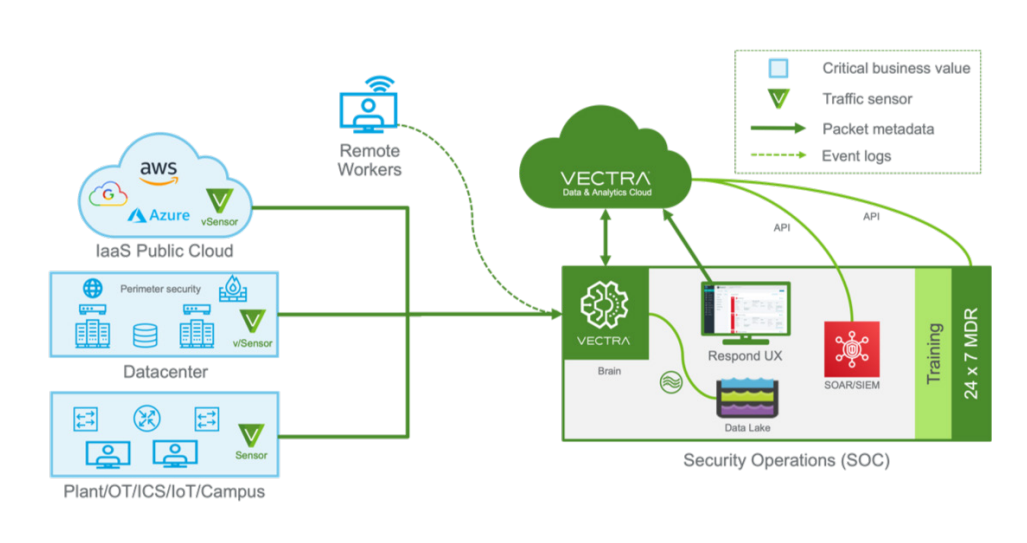
Arquitectura del «cerebro» y los sensores en las implementaciones de NDR
La arquitectura central de NDR se compone de dos tipos principales de dispositivos: el «Brain» y el «Sensor». Cada uno de ellos desempeña una función distinta, y su interacción es lo que permite convertir el análisis del tráfico de red sin procesar en alertas de seguridad priorizadas.
Los dispositivos sensores capturan el tráfico de red sin procesar en puntos de captura designados, centros de datos, entornos de campus, cloud y ubicaciones remotas. Los sensores deduplican el tráfico antes de reenviar los metadatos al Brain. Mantienen un búfer de captura continuo que permite la recuperación a nivel de paquete (PCAP) cuando sea necesario para la investigación. El vSensor es la variante virtual, que se puede implementar en hipervisores o cloud IaaS.
Los dispositivos Brain reciben metadatos de uno o varios sensores emparejados y los procesan localmente utilizando modelos de IA conductual para generar detecciones. Comprender cómo la detección basada en metadatos mejora la visibilidad de las amenazas es fundamental para evaluar por qué esta arquitectura supera a los enfoques centrados en registros para la supervisión del tráfico este-oeste y los escenarios de ataques basados en identidades. En las implementaciones cloud(Respond UX), el Brain envía los datos de detección y los metadatos a la cloud de Vectra cloud su presentación en la interfaz de gestión. En las implementaciones locales (Quadrant UX), el Brain aloja la interfaz de usuario de gestión de forma local.
Los dispositivos de modo mixto combinan las funciones de Brain y Sensor en una sola unidad, lo que los hace idóneos para implementaciones de menor envergadura o entornos en los que no se justifica una arquitectura de dos dispositivos.
Tipo de electrodoméstico
Función principal
Características principales
Cerebro
Procesa metadatos; genera alertas; se comunica con cloud de Vectra
Se instala en las instalaciones del cliente; inicia todas cloud salientes cloud ; actúa como intermediario de comunicaciones para las implementaciones de RUX
Sensor (físico)
Captura y elimina duplicados del tráfico de red sin procesar
Debe emparejarse con un Brain; reenvía metadatos; alberga un búfer PCAP de flujo continuo; opcionalmente, ejecuta las detecciones de anomalías de protocolos Vectra Match Suspect.
vSensor (virtual)
Igual que el sensor físico; se puede implementar en hipervisores o en cloud IaaS
Se vincula a Brain mediante un token de registro; sin costes adicionales de licencia
Aparato de modo mixto
Desempeña funciones tanto de «cerebro» como de «sensor»
Ideal para implementaciones de menor envergadura; reduce el espacio que ocupa la infraestructura
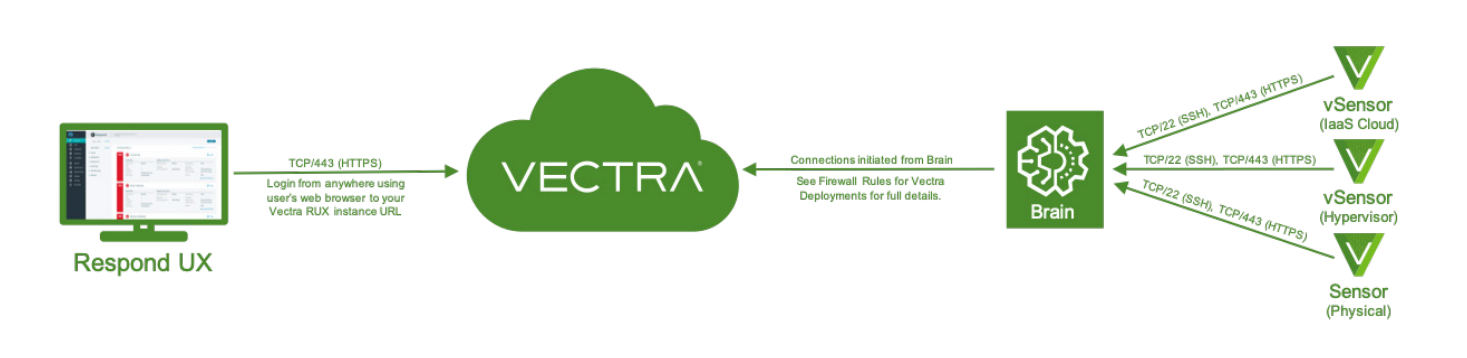
Comunicación y emparejamiento:
Los sensores se comunican con su Brain emparejado a través de los puertos TCP/22 (SSH) y TCP/443 (HTTPS)
Por lo general, los sensores solo se comunican con el Brain y el DNS, no directamente con sistemas externos
Los dispositivos Brain inician todas las conexiones salientes hacia la cloud de Vectra
Las actualizaciones se envían desde la cloud de Vectra cloud Brain y se transmiten automáticamente a los sensores emparejados
Se admiten implementaciones con aislamiento físico (solo en Quadrant UX), con detecciones generadas localmente en el Brain
Los sensores físicos pueden recuperar la IP del Brain desde la cloud de Vectra cloud el arranque inicial a través de TCP/443, lo que permite el emparejamiento automático con DHCP
Recomendación de implementación: Los dispositivos Brain y Sensor deben ubicarse en puntos de la red que no sean directamente visibles desde la Internet pública. Se recomienda utilizar una conexión privada o un túnel VPN con punto de salida fuera de los dispositivos Vectra. Las detecciones de NDR se centran en las comunicaciones entrantes y salientes; no se recomienda capturar el tráfico fuera de los cortafuegos perimetrales en la DMZ.
Consideraciones sobre la implementación, el escalado y la vista global
Las implementaciones de NDR abarcan desde entornos de un solo sitio hasta grandes empresas globales distribuidas. Comprender la capacidad de los dispositivos y la arquitectura multiinstancia es fundamental para los equipos que planifican implementaciones a escala empresarial.
Dimensionamiento de electrodomésticos
La siguiente tabla muestra los niveles de rendimiento actuales de los dispositivos. El rendimiento real varía en función de la composición del tráfico; consulte con su equipo de cuentas para determinar la combinación adecuada de dispositivos físicos y virtuales para su entorno.
Tipo de electrodoméstico
Rendimiento máximo
Notas adicionales
Cerebro
75 Gbps
Admite hasta 500 sensores emparejados
Sensor
50 Gbps
Solo detección estándar de NDR
Sensor (con detección de anomalías mediante el protocolo Match Suspect)
33 Gbps
Disminución del rendimiento al ejecutar módulos de detección adicionales
vSensor / Virtual Brain / Stream
Depende de la configuración del servidor
No hay costes de licencia adicionales más allá de las métricas estándar del entorno
Nota: Vectra lanza periódicamente nuevas configuraciones de dispositivos para dar respuesta a los requisitos actualizados de rendimiento, hipervisores y cloud . Consulte siempre las especificaciones del dispositivo y del sensor para obtener información actualizada antes de dimensionar una implementación.
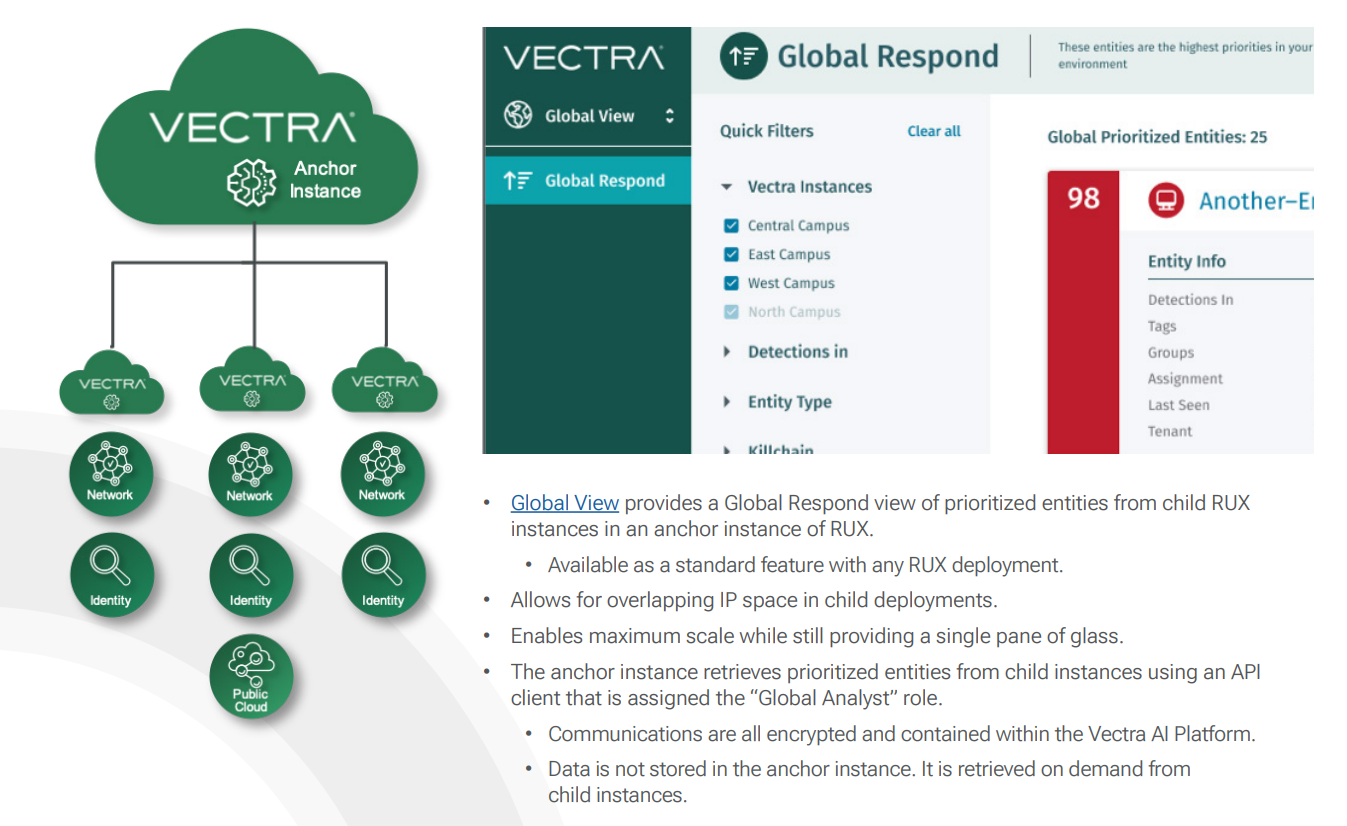
Visión global para empresas distribuidas
Las organizaciones que gestionan múltiples sedes o unidades de negocio pueden implementar Global View en entornos SOC distribuidos para mantener una visión unificada de la detección en distintas instancias de NDR. Global View agrupa los datos de entidades priorizados procedentes de las instancias secundarias de Respond UX en una instancia principal, lo que ofrece una vista de gestión única sin necesidad de centralizar los datos almacenados.
Característica
Comportamiento de Global View
Disponibilidad
Funcionalidad estándar en cualquier implementación de Respond UX
Espacio de direcciones IP
Se admite la superposición de espacios de direcciones IP entre implementaciones secundarias
Almacenamiento de datos
No se almacena en la instancia principal, sino que se recupera bajo demanda de las instancias secundarias
Comunicaciones
Cifrado e integrado en la Vectra AI
Modelo de acceso
Anchor recupera entidades priorizadas a través del cliente API con el rol de «Analista global»
Finalidad de la escala
Permite alcanzar la máxima escalabilidad en empresas internacionales a través de una única interfaz
Análisis del tráfico de red en la práctica: resultados de la implementación, 2023-2025
El análisis del tráfico de red ofrece resultados cuantificables cuando se implementa correctamente, pero dichos resultados dependen directamente de las decisiones arquitectónicas: dónde se colocan los sensores, qué tráfico se captura, cómo se determina la identidad a partir de los protocolos y cómo se priorizan las detecciones en todo el entorno. Los siguientes casos ilustran los resultados que ofrece la arquitectura en implementaciones de producción en distintos entornos de red.
Goodwood Estate — visibilidad este-oeste del 20 % al 95 % (2024) Antes de implementar NDR, Goodwood Estate contaba con una supervisión del tráfico este-oeste que cubría aproximadamente el 20 % de su infraestructura distribuida. Los puntos ciegos en el campus, el IoT y los entornos de tecnología operativa dejaban sin supervisar importantes rutas de movimiento lateral. Tras implementar sensores en segmentos de la red interna, y no solo en el perímetro, la visibilidad este-oeste alcanzó el 95 %, cerrando las brechas de cobertura que las herramientas perimetrales tradicionales no pueden abordar por su propio diseño.
Schaefer Kalk — Detección de un ataque de ransomware que eludió el EDR (2023) Los controles de puntos finales de Schaefer Kalk no lograron detectar una campaña activa de ransomware que se movía lateralmente por la red. El análisis del tráfico de red, que examina los flujos este-oeste que el EDR no puede observar, detectó el movimiento lateral y contuvo el ataque antes de que llegara a los sistemas de producción.
Globe Telecom: reducción del ruido de las alertas en un 99 % y respuesta un 75 % más rápida (2024). Globe Telecom redujo el tiempo de respuesta ante incidentes de 16 horas a 3,5 horas. El ruido de las alertas se redujo en un 99 % y las escalaciones disminuyeron en un 96 %, lo que permitió a los analistas centrarse en seis incidentes reales en lugar de en cientos de miles de alertas de bajo valor. El factor subyacente: una priorización basada en el riesgo, construida sobre IA conductual que opera a través de cloud de red, identidad y cloud , en lugar de la comparación de firmas con alertas individuales.
Una organización sanitaria internacional: detección de un uso indebido de credenciales que el SIEM no había detectado (2024) A los pocos días de su implementación, el análisis del tráfico de red detectó credenciales robadas, cloud , intentos de escalada de privilegios y actividad de persistencia en AWS que el SIEM de la organización no había logrado detectar. La detección de identidades a partir de protocolos de red —Kerberos, LDAP, DCE/RPC— proporcionó la señal que los sistemas basados en registros no pudieron reconstruir. El SOC intervino antes de que los datos o las operaciones se vieran afectados.
Conclusión clave: los resultados dependen de la ubicación de los sensores en los segmentos este-oeste, de que el protocolo capture el tráfico de autenticación y de que se utilicen modelos de comportamiento que analicen los movimientos de identidades a lo largo de la red, en lugar de basarse en alertas aisladas en puntos finales individuales.
Cómo Vectra AI el análisis del tráfico de red
El análisis del tráfico de red Vectra AI se basa en cuatro capas de ingeniería que funcionan conjuntamente para convertir los datos brutos de telemetría de red e identidad en detecciones priorizadas y procesables. No se trata de capacidades generales de NDR, sino que describen las decisiones arquitectónicas específicas que determinan el rendimiento de la plataforma en entornos de producción híbridos,cloud y basados en la identidad.
Nivel 1: Modelización del comportamiento del atacante
Cada detección se basa en investigaciones de seguridad, no en anomalías estadísticas. Los modelos se corresponden directamente con MITRE ATT&CK y técnicas MITRE ATT&CK en los ámbitos de la red, la identidad, cloud y el SaaS.
Los ingenieros de detección y los científicos de datos definen tres aspectos para cada técnica de ataque:
Qué hay que detectar
¿Qué datos de telemetría se necesitan para detectarlo?
¿Qué modelo de IA/aprendizaje automático es el adecuado para ese problema concreto?
Los modelos se seleccionan en función del problema —uso indebido de credenciales, movimiento lateral, comando y control, persistencia— y no se aplican de forma genérica. Esto garantiza que las detecciones sean explicables, repetibles y defendibles, con una relación clara entre la técnica del atacante y el resultado de la defensa. Vectra AI contribuido e influido en la forma en que la comunidad de seguridad en general entiende y mapea las técnicas ATT&CK basadas en la red y en la identidad.
Capa 2: Jetstream — motor de transmisión en tiempo real
Jetstream procesa los datos de telemetría de red e identidad en tiempo real, no a posteriori.
A diferencia de los sistemas basados en lotes y centrados en los registros, que almacenan el tráfico y lo analizan posteriormente, Jetstream recopila, enriquece y correlaciona la telemetría de forma continua a medida que se producen los eventos en toda la empresa híbrida. Esto es lo que permite detectar patrones de comportamiento mientras se está produciendo un ataque, en lugar de minutos u horas después.
En lo que respecta al control del tráfico este-oeste en particular, la transmisión en tiempo real es fundamental. Los sistemas basados en ciclos de procesamiento por lotes no pueden detectar de forma fiable los movimientos laterales que se desarrollan a lo largo de varios minutos.
Capa 3: Estructura de señal de metadatos
En lugar de basarse en la captura completa de paquetes o en la importación de registros sin procesar, Vectra AI , normaliza y enriquece los metadatos relevantes para la seguridad de toda la red híbrida.
Entre las fuentes se incluyen:
Flujos de red
Eventos de identidad
Cloud
Interacciones SaaS
Telemetría de infraestructuras
Cada registro de metadatos se enriquece continuamente con información contextual —identidad, función del activo, historial de comportamiento, fase del ataque y perfil de riesgo—, lo que crea una capa de inteligencia compartida en los flujos de trabajo de detección, investigación y respuesta. Los analistas obtienen una visibilidad profunda sin la sobrecarga de almacenamiento y rendimiento que supone gestionar la captura completa de paquetes a gran escala.
Capa 4: Atribución multicapa
En entornos en los que los atacantes hacen uso indebido de identidades, se hacen pasar por servicios y se desplazan lateralmente, la atribución debe ir más allá de las direcciones IP y la correlación de eventos aislados.
La atribución multicapa Vectra AI vincula continuamente la actividad entre usuarios, cuentas de servicio, cargas de trabajo, hosts e infraestructura mediante la combinación del comportamiento de la red, el contexto de identidad y la información sobre privilegios. Tres capacidades se combinan para hacer esto posible:
Característica
Comportamiento de Global View
Disponibilidad
Funcionalidad estándar en cualquier implementación de Respond UX
Espacio de direcciones IP
Se admite la superposición de espacios de direcciones IP entre implementaciones secundarias
Almacenamiento de datos
No se almacena en la instancia principal, sino que se recupera bajo demanda de las instancias secundarias
Comunicaciones
Cifrado e integrado en la Vectra AI
Modelo de acceso
Anchor recupera entidades priorizadas a través del cliente API con el rol de «Analista global»
Finalidad de la escala
Permite alcanzar la máxima escalabilidad en empresas internacionales a través de una única interfaz
En conjunto, estas capas permiten a la plataforma determinar con certeza quién está haciendo qué, dónde y con qué nivel de privilegios, incluso cuando los atacantes utilizan credenciales válidas y se camuflan entre los patrones de tráfico normales.
Conclusión
La detección y respuesta en la red no es una simple decisión sobre un producto, sino un conjunto de decisiones de ingeniería interrelacionadas que determinan si su equipo de seguridad puede detectar los movimientos laterales en tiempo real, extraer información sobre la identidad a partir de los protocolos de red, analizar el tráfico cifrado sin necesidad de descifrarlo y ampliar la detección a entornos distribuidos sin centralizar los datos almacenados.
Los aspectos fundamentales que se tratan en esta página se traducen directamente en resultados operativos: la ubicación de los sensores en el eje este-oeste determina si el movimiento lateral se observa o se deduce; las decisiones sobre la captura de protocolos determinan si los ataques basados en la identidad son visibles o invisibles; el diseño de un canal paralelo determina si el análisis del tráfico cifrado reduce la precisión de la detección; y la arquitectura Global View determina si las implementaciones distribuidas ofrecen una visibilidad unificada o una cobertura fragmentada.
Descubre cómo la plataforma Vectra AI ofrece un análisis del tráfico de red capaz de detectar movimientos laterales, el uso indebido de identidades y los sistemas de comando y control cifrados, identificando lo que las herramientas perimetrales y los agentes de los puntos finales pasan por alto.
_tNail.jpg)